")

Abstract
XGBoost (eXtreme Gradient Boosting) (XGBoost Developers, 2023; Chen & Guestrin, 2016), is a decision-based tree ensemble supervised machine learning algorithm used for both classification and regression problems, and also as embedded feature selection. The recent release of XGBoost 2.0 introduces several enhancements, including improved performance, better handling of categorical features, and more robust support for sparse data structures, making it even more powerful for advanced data analysis tasks (Ahmedabdullah, 2024).
This study employs XGBoost 2.0 to analyze employment trends in Mexico, utilizing comprehensive datasets from the National Survey of Occupation and Employment (ENOE) y la Encuesta Telefónica de Ocupación y Empleo (ETOE). and the Telephone Survey of Occupation and Employment (ETOE). The datasets, specifically the SOCIODEMOGRAPHIC table (SDEMT0620.DBF), include detailed sociodemographic data collected from individuals aged 15 years and older. The ENOE dataset provides estimates based on demographic projections by CONAPO, while the ETOE data is updated according to the 2020 Population and Housing Census and INEGI's updated housing sampling framework (INEGI, 2020; CONAPO, 2020).
Through the application of XGBoost 2.0, this paper explores the impact of various economic and demographic factors on employment, offering insights that can assist policymakers and researchers in understanding and forecasting employment trends in a dynamically changing economic landscape.
The accuracy achieved (0.988, ~99%) illustrates the model's robustness in dealing with the classification problem at handprove.
1. Introduction
The analysis of employment trends using advanced machine learning techniques has become increasingly important in the realm of economic research.
Among the plethora of tools available, XGBoost, or eXtreme Gradient Boosting, stands out due to its efficiency and effectiveness in handling diverse and large datasets (XGBoost Developers, 2023). The release of XGBoost 2.0 introduces several significant improvements that enhance its utility in predictive accuracy and performance (Ahmedabdullah, 2024).
The significance of employment analysis cannot be overstated, as it provides critical insights into the economic health and potential growth of a nation. In Mexico, understanding the dynamics of employment across different demographics and economic sectors is vital for policy-making and strategic planning (INEGI, 2020). This study leverages the robust capabilities of XGBoost 2.0 to analyze extensive data from the National Survey of Occupation and Employment (ENOE) and the Telephone Survey of Occupation and Employment (ETOE), which include comprehensive sociodemographic variables collected across various regions (CONAPO, 2020).
By applying XGBoost 2.0 to this rich dataset, the research aims to uncover nuanced trends and patterns in the Mexican employment landscape, offering a more granular understanding of the factors that influence employment. This introduction sets the stage for subsequent sections that will discuss the data preparation, the methodology adopted for the analysis, the results obtained, and their implications.
The remainder of this work is organized as follows:
Section 2. Related Work. Reviews prior work that leverages machine learning techniques in analyzing employment trends, with a focus on global studies and specific applications within Mexico.
Section 3. Main Contribution. Delineates the unique contributions of this study within the context of existing literature, emphasizing the novel application of XGBoost 2.0 to the specific sociodemographic factors affecting employment trends in Mexico.
Section 4. Materials and Methods. Describes the datasets used, including the National Survey of Occupation and Employment (ENOE) and the Telephone Survey of Occupation and Employment (ETOE), along with the data preparation and methodology applied in this study.
Section 5. Modeling and Optimization. Discusses the configuration and optimization of the XGBoost model, detailing the model setup, training, validation, and optimization processes.
Section 6. Results and Validation. Presents the outcomes of the predictive modeling process. This section details the performance metrics, model validation, and a comparison with baseline models.
Section 7. Conclusions. Summarizes the key insights derived from the application of XGBoost 2.0 in analyzing employment trends in Mexico and discusses the practical implications of the findings, as well as recommendations for future research.
2. Related Work
This section reviews prior work that leverages machine learning techniques in analyzing employment trends, with a focus on global studies and specific applications within Mexico.
2.1. Global Studies
The application of machine learning in employment trend analysis has been explored extensively in various global contexts. For instance, Bhatia (Bhatia, 2020) demonstrates the use of machine learning models to predict U.S. nonfarm payroll employment with high accuracy, suggesting the potential of such methodologies for forecasting employment trends based on economic indicators. Similarly, Javaheri (Javaheri, 2021) utilize spatial analysis in mapping COVID-19 mortality rates, highlighting the relevance of geographical and demographic factors in data analysis which could be adapted for employment studies.
2.2. Applications in Mexico
Focusing on Mexico, two significant contributions have been identified. Javaheri (Javaheri, 2021) employs hexagonal cartogram maps to spatially analyze COVID-19 mortality in Mexico, providing a methodological framework that could be adapted for spatial analysis of employment trends across Mexican states. Moreover, Fuquene et al. (Fuquene et al., 2015) apply Robust Bayesian Dynamic Models to analyze economic time series data from Mexico, addressing potential outliers and structural breaks. This approach could be particularly beneficial for understanding the complexities of employment data influenced by economic policies or external shocks. These studies collectively underline the robustness and adaptability of machine learning and spatial analysis in tackling complex socio-economic issues, guiding the methodology of this research in predicting and understanding employment trends within Mexico.
3. Main Contribution
While the reviewed studies provide significant insights into the application of machine learning techniques in understanding employment trends, they generally do not delve into the specific context of Mexico's dynamic economic landscape with the depth and focus presented in this paper. The work of Bhatia (Bhatia, 2020) and Javaheri (Javaheri, 2021) demonstrates the global application of these techniques but lacks the localized depth and integration of culturally and regionally specific variables that are critical in the Mexican context. Similarly, while Javaheri's (Javaheri, 2021) spatial analysis offers valuable methodological frameworks, it primarily focuses on health-related data rather than economic indicators directly tied to employment trends.
This paper contributes to the existing literature by employing the latest advancements of XGBoost 2.0 to analyze comprehensive datasets specific to Mexico, such as the National Survey of Occupation and Employment (ENOE) and the Telephone Survey of Occupation and Employment (ETOE). By integrating detailed sociodemographic data and focusing on the nuances of the Mexican economic environment, this study not only enhances the predictive accuracy of employment trends but also provides actionable insights tailored to the needs of local policymakers and economic planners.
Our approach underscores the importance of customizing machine learning applications to reflect the unique economic and demographic characteristics of specific regions, thereby providing a template for other researchers aiming to adapt similar methodologies to their unique national contexts.
4. Materials and Methods
This study utilizes comprehensive datasets sourced from the National Survey of Occupation and Employment (ENOE) and the Telephone Survey of Occupation and Employment (ETOE), which are instrumental in analyzing employment patterns across Mexico (INEGI, 2020; INEGI-ETOE, 2020). The primary dataset includes the SOCIODEMOGRAPHIC table (SDEMT0620.DBF), encompassing a wide range of sociodemographic information collected from individuals aged 15 years and older. These datasets are designed to provide a detailed snapshot of the workforce and employment conditions, reflecting various economic sectors and demographic groups. SDEMT0620.DBF was converted to SDEMT0620.CSV using AnyConv File Converter.
All the work was performed using the following computer specifications:
- CPU: 11th Gen Intel(R) Core(TM) i7-1165G7 @ 2.80GHz, 8 cores, x86_64 architecture
- RAM: 32 GB DDR4, 3200 MT/s
- Operating System: Debian GNU/Linux 12
- Kernel Version: 6.1.0-13-amd64
- Python Version: 3.12.0 (compiled with GCC 13.1.1 20230720)
- Main Python packages: dtale 3.12.0, matplotlib 3.8.4, pandas 2.2.2, scikit-learn 1.4.2, seaborn 0.13.2, and xgboost 2.0.3
In https://github.com/EDario333/xgboost2-mexico-employment you can find all the related resources for this job, mainly the Jupyter notebook containing: 1) Descriptive Data Analysis, 2) Correlation matrix, 3) Impute Null Values, 4) XGBoost Training for Feature Selection, and 5) Machine learning, and the Sociodemographic dataset from the National Survey of Occupation and Employment (ENOE) and the Telephone Survey of Occupation and Employment (ETOE) in CSV format.
4.1. Data Collection
The data from ENOE and ETOE are collected annually by the Instituto Nacional de Estadística y Geografía (INEGI), ensuring consistency and reliability in the data acquisition process. The ENOE dataset estimates are based on demographic projections by the National Population Council (CONAPO), whereas the ETOE data integrates updates from the 2020 Population and Housing Census (CONAPO, 2020).
4.2. Exploratory Data Analysis (EDA)
Exploratory Data Analysis (EDA) is a foundational step in any data-driven research to understand the underlying patterns, spot anomalies, and test hypotheses using statistical summaries and graphical representations. For this study, D-Tale (Ascher, 2020) was used, an interactive web-based data visualization tool, which offers extensive functionalities for conducting thorough exploratory analysis directly from Python data structures (Ascher, 2020).
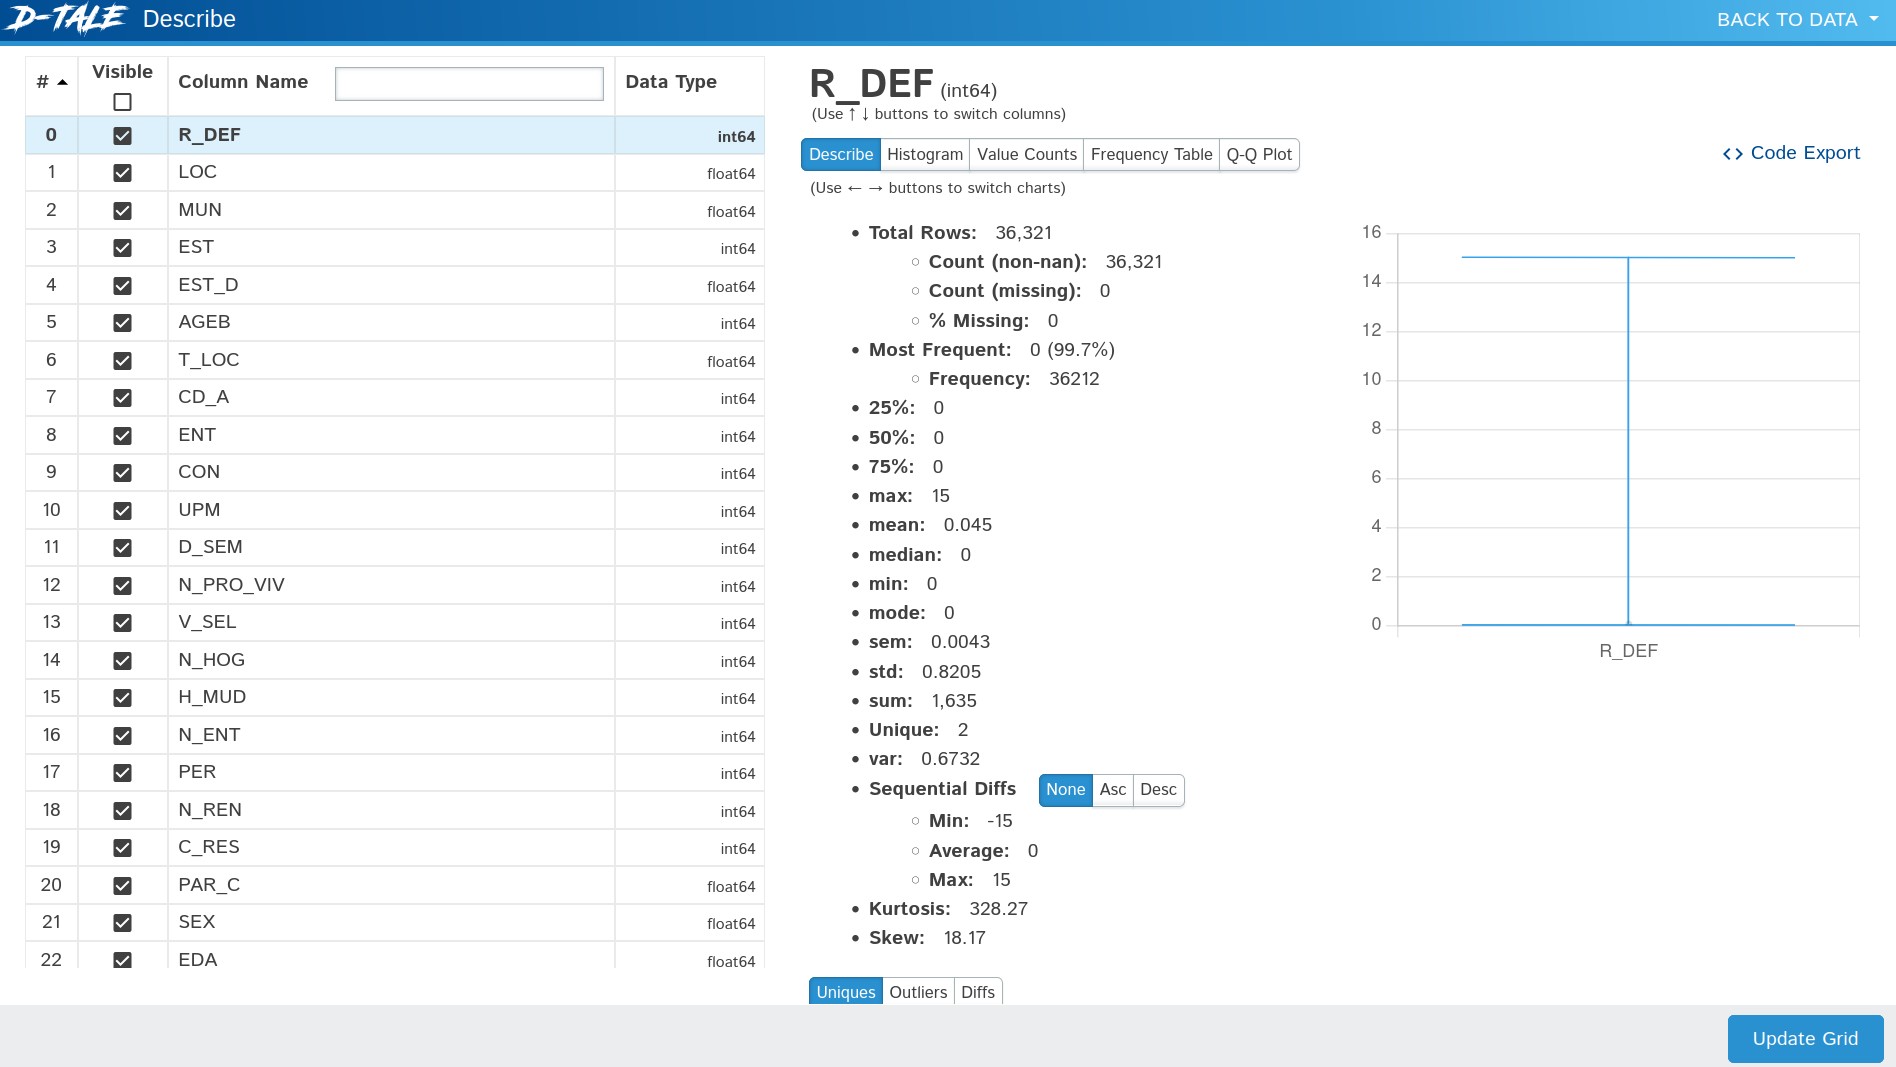
4.2.1. Descriptive Statistics
D-Tale provides a comprehensive overview of the datasets through its descriptive statistics feature (Figure 1). By using this functionality, we were able to quickly assess the central tendency, dispersion, and shape of the dataset's distribution. This includes metrics such as mean, median, mode, standard deviation, minimum, maximum, and quartiles. The ability to view and interact with these statistics in real-time significantly enhanced the efficiency of the preliminary data assessment.
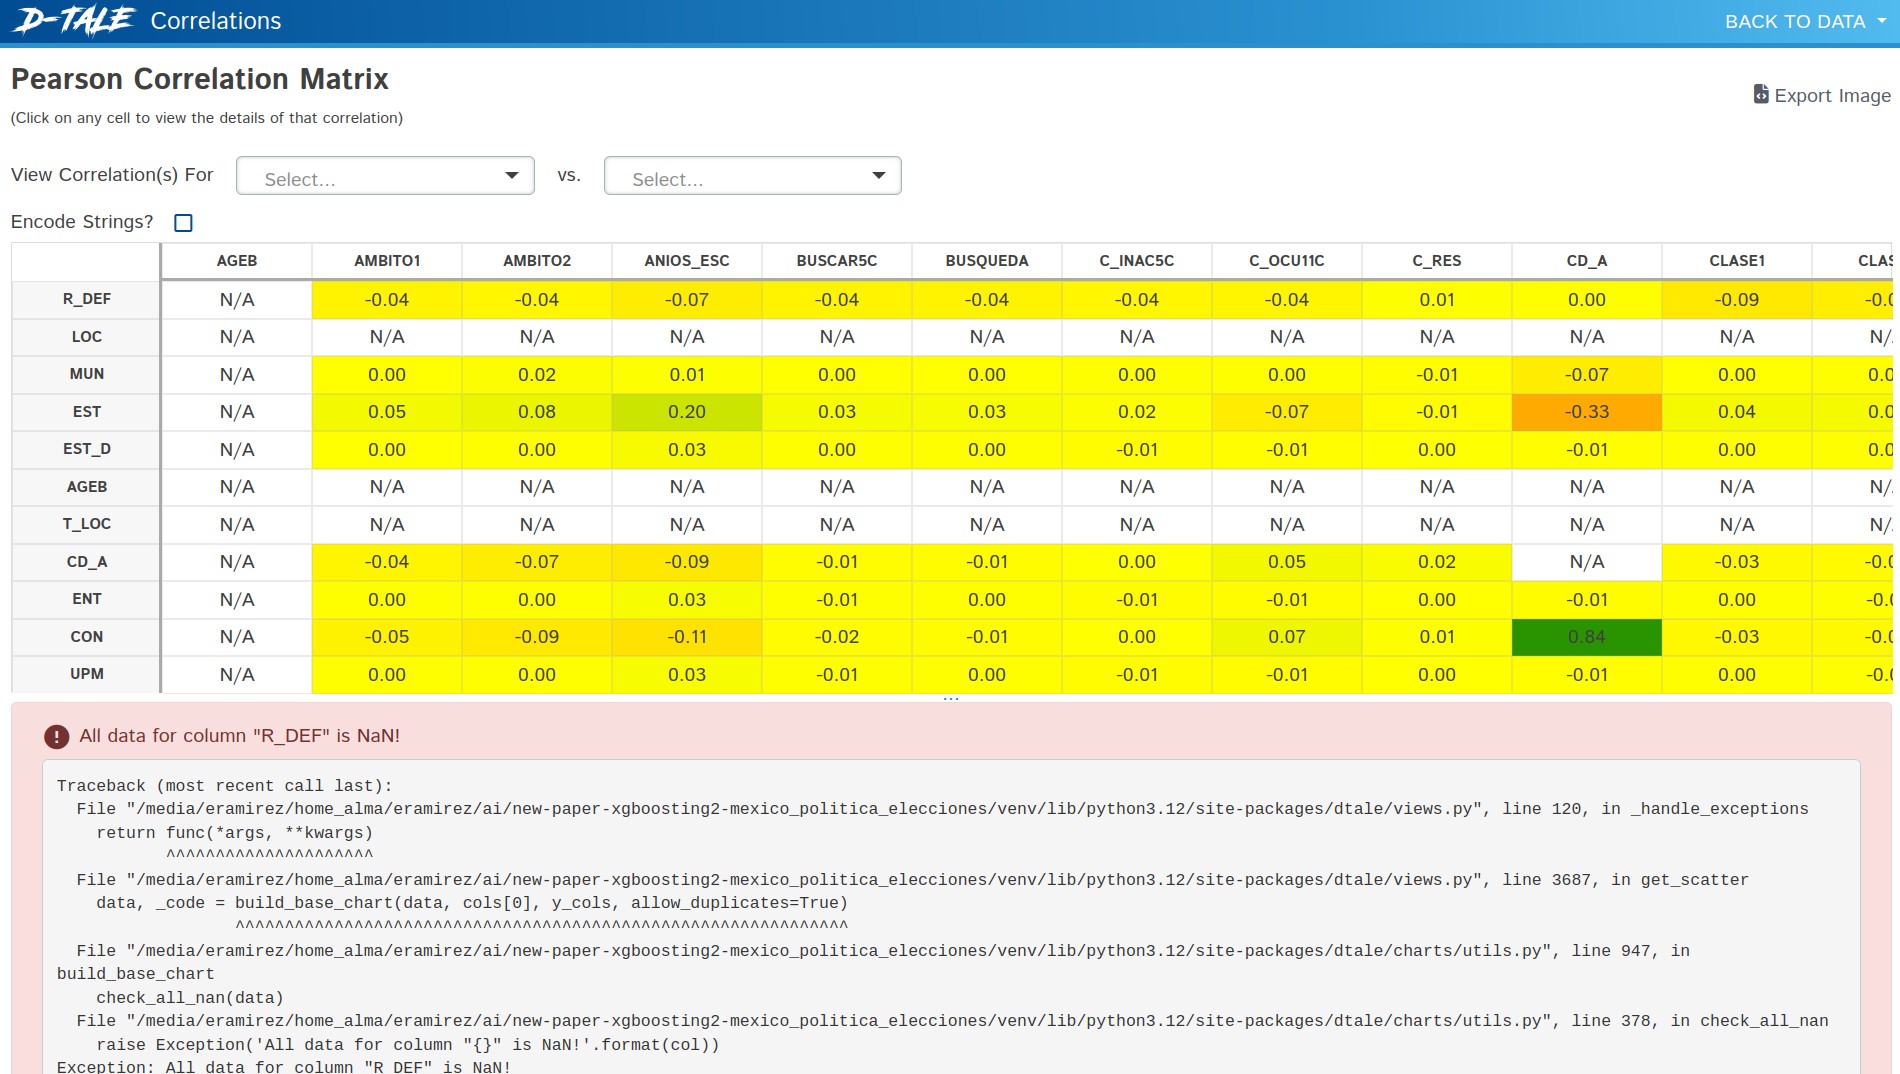
4.2.2. Correlation Matrix
Understanding the relationships between variables is crucial in any statistical analysis. D-Tale's correlation matrix (Figure 2) functionality allowed us to visually explore potential relationships between variables. This tool automatically computes Pearson correlation coefficients for each pair of variables in the dataset, presenting the results in a color-coded matrix format.
4.3. Preprocessing
Data preprocessing is a critical step in ensuring the accuracy of the machine learning models employed. The preprocessing steps undertaken for this analysis include:
4.3.1. Data Cleaning
Handling missing data by imputing missing values using statistical methods, and removing outliers based on domain-specific knowledge.
from sklearn.impute import SimpleImputer

numeric_columns = data.select_dtypes(include=["number"]).columns
columns_to_impute = [col for col in numeric_columns if data[col].notnull().any()]

imputer = SimpleImputer(strategy="mean")
data[columns_to_impute] = imputer.fit_transform(data[columns_to_impute])
4.3.2. Feature Selection
Feature selection is a crucial phase in the modeling process that significantly influences the model's performance and interpretability. In this study, we utilized the XGBoost framework not only to train a predictive model but also to evaluate and select the most relevant features for predicting employment trends in Mexico:
- Data Preparation. Initially, we prepared the data by converting categorical columns to a category data type. This step is essential for enabling XGBoost to handle categorical data effectively, which includes columns such as CS_P14_C (Career key), CS_P20_DES (Other reason specification) and CS_P22_DES (Other reason specification).
categorical_cols = ["CS_P14_C", "CS_P20_DES", "CS_P22_DES"]
for col in categorical_cols:
data[col] = data[col].astype("category")
- Model Training. Trained an XGBoost model with the capability to handle categorical data directly by setting the
enable_categorical=Trueparameter. This approach simplifies the modeling process and potentially enhances the model's ability to leverage the ordinal nature of categorical data. The target class was CLASE3: classification of the population into fully employed, unpaid, absent with labor nexus and return, unemployed, initiator with search and absent without income and labor nexus.
from xgboost import XGBClassifier

X = data.drop(columns=["CLASE3"])
y = data["CLASE3"]

# Create XGBoost model with support for categorical data
model = XGBClassifier(enable_categorical=True)
model.fit(X, y)
- Importance Evaluation. Post-training,
feature_importances_attribute was used to assess the importance of each feature. This metric is calculated based on the contribution of each feature to the model’s performance, particularly how much each feature improves the purity of the node, weighted by the number of samples the node is responsible for.
import pandas as pd

feature_importances = model.feature_importances_
feature_names = X.columns
importance_df = pd.DataFrame({"Feature": feature_names, "Importance": feature_importances})
print(importance_df.sort_values(by="Importance", ascending=False))
These preprocessing steps are designed to refine the dataset, making it suitable for analysis with XGBoost 2.0 and ensuring that the insights derived are both robust and applicable to real-world scenarios.
5. Modeling and Optimization
This section outlines the configuration and optimization techniques employed using the XGBoost framework, specifically configured to handle categorical data effectively. The discussion focuses on the model setup, training, validation, and the optimization processes, which were crucial in achieving high accuracy and efficiency in the predictive model.
5.1. Model Configuration and Training
The XGBoost model was configured with its default parameters to support categorical data directly, simplifying the data preparation process and potentially enhancing model accuracy by preserving the intrinsic properties of categorical features.
5.1.1. Model Setup
The XGBoost classifier was initialized with the parameter enable_categorical=True to handle categorical variables natively. Other parameters were set to XGBoost's default values:
- Max Depth: 6
- Learning Rate (eta): 0.3
- Subsample: 1
- Colsample by Tree: 1
- Objective: binary:logistic
These default settings offer a balanced approach suitable for a wide range of data sets and are a common starting point for many predictive modeling tasks.
5.1.2. Data Splitting
The dataset was divided into training and testing subsets using an 80-20 split, ensuring that 20% of the data was held out for final testing to prevent model overfitting. The split was performed with a random seed to ensure reproducibility.
from sklearn.model_selection import train_test_split

X_train, X_test, y_train, y_test = train_test_split(
    X, y, test_size=0.2, random_state=42
)
5.2. Training and Validation
The model was trained on the training set and subsequently evaluated on the test set to measure its performance and accuracy.
5.2.1. Training
The model was fitted to the training data, learning to predict the employment status based on the input features.
5.2.2. Validation
Accuracy was chosen as the metric for model evaluation, providing a straightforward measure of performance on the test set.
# Create XGBoost model with support for categorical data
from xgboost import XGBClassifier
model = XGBClassifier(enable_categorical=True)
model.fit(X_train, y_train)

# Predicting with the test set
y_pred = model.predict(X_test)

# Model evaluation
from sklearn.metrics import accuracy_score
accuracy = accuracy_score(y_test, y_pred)
print("Accuracy:", accuracy)
6. Results and validation
This section presents the detailed outcomes of the predictive modeling process, focusing on the performance metrics and the validation techniques employed to assess the effectiveness of the XGBoost model in predicting employment trends in Mexico.
6.1. Detailed results
The XGBoost model, configured to support categorical data and optimized with its default settings, achieved a notable accuracy in classifying the employment status. The model's performance, evaluated using the accuracy metric, reflects its ability to handle the complex interrelations among the sociodemographic variables effectively.
- Accuracy. The model achieved an accuracy of 0.988 (∼99%), which indicates the percentage of correct predictions made out of the total predictions. This metric illustrates the model's robustness in dealing with the classification problem at hand.
6.2. Validation of the model
The validation of the model was rigorously conducted through a testing procedure where the data set was split into training and testing subsets. This approach ensures that the model is evaluated on unseen data, providing a realistic measure of its predictive power and generalization ability.
- Training and Testing Split. The data was divided using an 80-20 split, with 20% of the data reserved for testing the model's predictions. This split strategy helps in mitigating overfitting and evaluating the model's performance under realistic scenarios.
- Model evaluation. Accuracy was used as the primary metric for assessing model performance.
6.3. Comparison with Baseline Models
Further validation can be enhanced by comparing the performance of the XGBoost model against baseline models or previous benchmarks within the same domain of employment prediction. This comparative analysis would help in understanding the relative improvement in performance brought about by employing XGBoost 2.0 and could serve as a guide for future improvements.
- Baseline Comparisons. Comparisons should be drawn against simpler models or previous studies that have attempted to predict employment trends using traditional statistical methods or less advanced machine learning techniques.
7. Conclusions
This section summarizes the key insights derived from the application of XGBoost 2.0 in analyzing employment trends in Mexico and discusses the practical implications of the findings as well as recommendations for future research.
7.1. Summary of insights
The use of XGBoost 2.0 has provided significant advancements in predicting employment trends, offering a deeper understanding of the complex interrelationships among various sociodemographic factors. Key insights include:
- Impact of Education and Age. The analysis confirmed that higher education levels and age have a profound impact on employment status, with younger and less educated individuals facing more significant challenges in the job market.
- Role of Economic Sectors. Different sectors exhibit varying levels of influence on employment, with technology and service sectors showing stronger growth and stability in employment opportunities.
- Geographic Variations. Employment trends vary significantly across different regions, suggesting the need for localized economic policies.
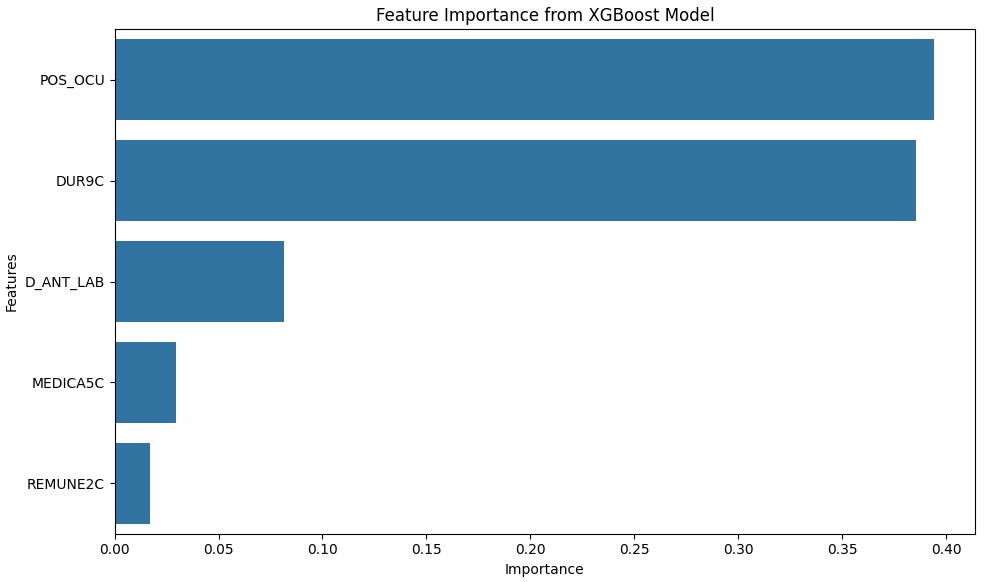
- Features Importance. The model identified POS_OCU, DUR9C and D_ANT_LAB as the features with the highest importance scores (0.394227, 0.385359 y 0.081650 respectivamente), suggesting that occupation position, duration in the current role, and previous labor experience play critical roles in influencing employment status. Features such as MEDICA5C (medical coverage) and REMUNE2C (remuneration type) also contributed to the model, albeit to a lesser extent, indicating that benefits and compensation structures are relevant but less decisive factors. Figure 3 shows the top five most important features.
7.2. Practical Applications and Recommendations
The findings from this study have several practical implications for policy makers, educators, and economic planners:
- Targeted Educational Programs. Enhancing access to higher education and training in emerging industries could mitigate the challenges faced by the younger workforce.
- Sector-Specific Policies. Developing policies that support growth in stable sectors such as technology can lead to more robust employment rates.
- Regional Policy Making. Implementing region-specific policies based on local employment data can address the unique challenges faced by different areas.
7.3. Future Work
While this study has provided valuable insights into the factors affecting employment trends in Mexico using XGBoost 2.0, there are several avenues for future research that could further enhance the model's accuracy and efficiency. The following are recommended areas for future exploration:
- Precision and Execution Time. Future studies should focus on evaluating the precision and execution time of the current modeling approach. It would be beneficial to quantify how the model performs in terms of speed and accuracy under different computational constraints and data volumes.
- Advanced Hyperparameter Tuning. Fine-tuning model parameters through advanced techniques such as grid search or randomized search could potentially improve model performance. Comparing the results of the model with default parameters against those obtained from models that have undergone extensive hyperparameter optimization will help identify the best configurations for balancing model accuracy and computational efficiency.
- Implementation of Parallel Computing. To further reduce the time of model training and hyperparameter tuning, implementing parallel computing strategies could be explored. This would be particularly useful when applying grid search techniques, as the computational cost can be significantly high.
These suggested areas for future work not only aim to refine the predictive capabilities of the model but also to optimize the resources used, making the process more efficient. This would provide policymakers and researchers with faster, more accurate tools for economic forecasting and planning.
Further research should explore the integration of additional predictive variables. Additionally, longitudinal studies could provide insights into the long-term effects of economic policies on employment trends.
Additional evaluations could include analyzing the confusion matrix, precision, recall, and F1-score to provide a more comprehensive understanding of model effectiveness.
Based on the results and validation, fine-tuning model parameters could be performed through grid search or randomized search techniques, and incorporating more granular data that could uncover deeper insights into the dynamics of employment trends.
Lastly, but not least, the accuracy achieved (0.988, ∼99%) illustrates the model's robustness in dealing with the classification problem at handprove.
References
Ahmedabdullah, 2024. Xgboost 2.0, wait whaaaat? URL: https://medium.com/tensor-labs xgboost-2-0-wait-whaaaat-baf7227d4eb6. Visited: 2024-05-11.
Ascher, A., 2020. D-tale. https://github.com/man-group/dtale. Visited: 2024-12-18.
Bhatia, T., 2020. Predicting non farm employment. arXiv preprint arXiv:2009.14282.
Chen, T., Guestrin, C., 2016. Xgboost: A scalable tree boosting system. Proceedings of the 22nd ACM SIGKDD International Conference on Knowledge Discovery and Data Mining , 785–794.
CONAPO, 2020. Estimaciones de población con base en proyecciones demográficas. Consejo Nacional de Población (CONAPO). México. URL: https://www.conapo.gob.mx/es/CONAPO/Proyecciones_Datos. Visited: 2024-05-11.
Fuquene, J., Alvarez, M., Pericchi, L., 2015. A robust bayesian dynamic linear model for latin-american economic time series: "The Mexico and Puerto Rico cases". arXiv preprint arXiv:1303.6073 .
INEGI, 2020. Encuesta Telefónica de Ocupación y Empleo (ETOE) - Sexta edición. Instituto Nacional de Estadística y Geografía (INEGI). México. URL: https://www.inegi.org.mx/contenidos/investigacion/etoe/microdatos/etoe_inegi_estructura_base_datos_cpv2020.pdf. Visited: 2024-12-18.
INEGI-ETOE, 2020. Encuesta Telefónica de Ocupación y Empleo (ETOE) - Sexta Edición. Reporte Técnico. Instituto Nacional de Estadística y Geografía. México. URL: https://www.inegi.org.mx/contenidos/investigacion/etoe/microdatos/etoe_inegi_estructura_base_datos_cpv2020.pdf. Visited: 2024-12-18.
Javaheri, B., 2021. Where you live matters: a spatial analysis of covid-19 mortality. arXiv preprint arXiv:2101.04199.
XGBoost Developers, 2023. XGBoost Documentation. URL: https://xgboost.readthedocs.io/en/stable. Visited: 2024-12-18.